Target Curves & Metering
Overview
Tonal Balance Control displays spectrum metering information for the track it is currently inserted on relative to a target curve. This is particularly useful when dealing with tonal balance issues that arise during mixing and mastering. Tonal Balance Control can help provide context and direction toward resolving issues with a mix or master lacking the low-end power or high-end brilliance found in professionally produced, radio-ready material..
Tonal Balance Control should live at the end of your processing chain
- To get the most out of the Tonal Balance Control plug-in, we recommend that it is inserted at the end of the processing chain on your master bus track.
- This ensures that the spectrum curve you are comparing to the currently selected target curve is after all other processing in your session.
- When Tonal Balance Control is last in the processing chain, it ensures that adjustments made to Neutron 2 or Ozone 8 EQ instances will affect the spectrum curve displayed in Tonal Balance Control.
The factory target curves in Tonal Balance Control represent typical spectral shapes found in different styles of music. These target curves were created by analyzing the spectral characteristics of numerous tracks across different genres/styles of music. The target curves display ranges of typical spectral variation across the frequency spectrum for these similar styles of music.
Meters
Broad View

Broad View displays target curve ranges split into four frequency bands.
- Low: 20 Hz - 250 Hz
- Low-mid: 250 Hz - 2 kHz
- Mid: 2kHz - 8 kHz
- High-mid: 8 kHz - 20 kHz
The blue bars shown in each frequency band represent the typical range of spectral variation for the selected target curve.
The white lines will update to show how your track compares to the target curve. You can make adjustments to Ozone and Neutron EQ instances to modify your mix to fall within the blue target ranges.
Fine View
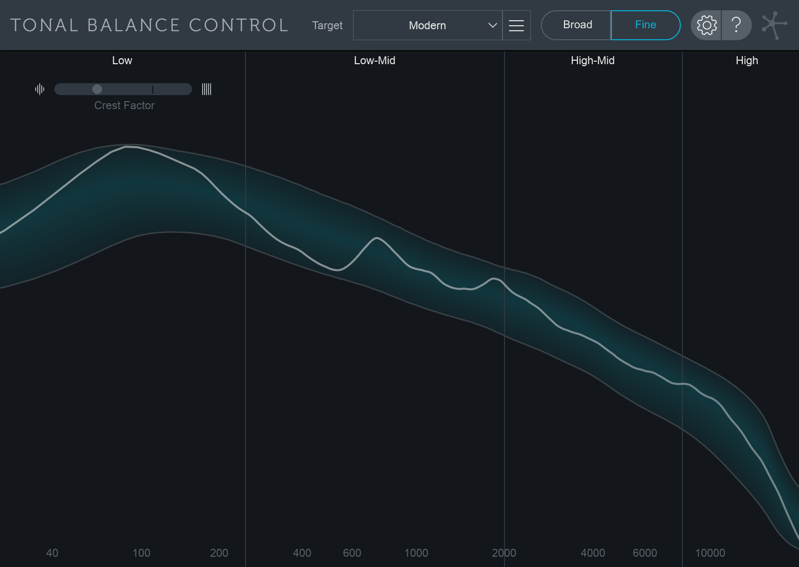
Displays the selected target curve range in blue across the frequency spectrum. The white spectrum curve in this view represents your current track.
Band Indicators

The frequency band labels will turn white when your current track is within the typical range for the selected target curve.
Crest Factor

The Crest Factor meter shows information about the low end dynamic range of your track. When the meter is weighted to the left, it indicates that your mix is ‘too dynamic’ in the low end. When weighted to the right, it indicates that your mix is ‘too compressed’ in the low end.
Target Curves
Tonal Balance Control comes with 3 factory target curves that represent the typical spectral curves found in major musical styles.
- Orchestral
- Bass Heavy
- Modern
Custom Target Curves
Clicking on the menu button to the left of the target curve dropdown menu exposes options for creating your own target curves to use in Tonal Balance Control.
| Supported File Formats |
|---|
| AIFF |
| WAV |
| MP3 |
| M4A |
| FLAC |
| OGG |
Create custom target curve from file…
Opens a system window that allows you to select an audio file to create a custom target curve.
Create custom target from folder of files…
Allows you to select a folder of audio files. Tonal Balance Control will create a single target curve based on all audio files included in the selected folder.
Save custom target curve…
Save the custom target curve you created to use again in the future.
Change target curve folder…
Allows you to select a different location to store and recall target curves.
Default Target Curve folder locations
- Mac: Users/username/Documents/iZotope/Tonal Balance Control/Target Curves
- Windows: C:\Users\username\Documents\iZotope\Tonal Balance Control\Target Curves
Show target curve folder in finder/explorer…
Opens a Finder (Mac) or Explorer (Windows) window to the current target curve directory.